Gallery / Color & legends
color
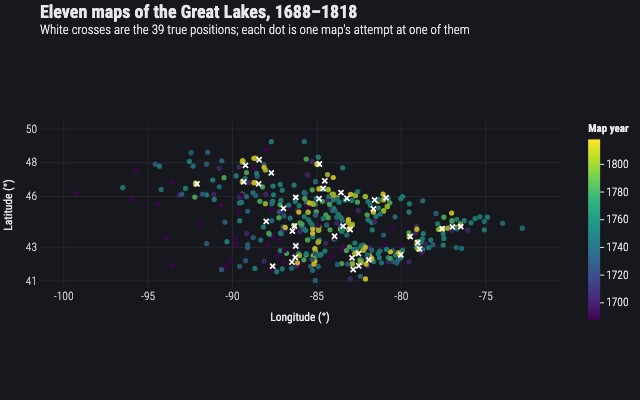
Eleven maps of the Great Lakes, 1688 to 1818
Thirty-nine identifiable points read off each old map against their true positions, with map year on a continuous colour ramp.
Source
Svelte, builder, JSON
<script lang="ts">
  import {
    CoordFixed,
    GeomPoint,
    GGPlot,
    Labs,
    ScaleColorContinuous,
    ThemeDark,
  } from "@ggsvelte/svelte";

  import { greatLakesSurveys, greatLakesTruth } from "./data.js";
</script>

<GGPlot
  data={greatLakesSurveys}
  aes={{ x: "long", y: "lat", color: "year" }}
  width={640}
  height={400}
>
  <ThemeDark />
  <CoordFixed />
  <ScaleColorContinuous scheme="viridis" labels="d" />
  <Labs
    title="Eleven maps of the Great Lakes, 1688–1818"
    subtitle="White crosses are the 39 true positions; each dot is one map's attempt at one of them"
    x="Longitude (°)"
    y="Latitude (°)"
    color="Map year"
  />
  <GeomPoint size={2.6} alpha={0.75} />
  <GeomPoint
    data={greatLakesTruth}
    aes={{ x: "long", y: "lat", color: { value: "#ffffff" } }}
    size={3.4}
    shape="cross"
  />
</GGPlot>
Meta
Details
- Family
- Color & legends
- Source
color/continuous- Rendering
- SVG
- Techniques
Related