Gallery / Distributions
dotplot
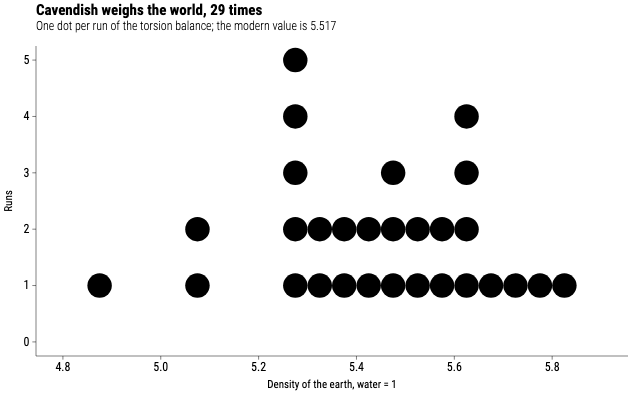
Cavendish weighs the world
Twenty-nine torsion-balance runs from 1798, one dot each, stacked where they fall. At this sample size a dotplot shows every measurement and still gives the shape.
Source
Svelte, builder, JSON
<script lang="ts">
  import {
    GeomDotplot,
    GGPlot,
    Labs,
    ScaleYContinuous,
    ThemeClassic,
  } from "@ggsvelte/svelte";

  import { earthDensity } from "./data.js";
</script>

<GGPlot data={earthDensity} aes={{ x: "density" }} width={640} height={400}>
  <ThemeClassic />
  <Labs
    title="Cavendish weighs the world, 29 times"
    subtitle="One dot per run of the torsion balance; the modern value is 5.517"
    x="Density of the earth, water = 1"
    y="Runs"
  />
  <ScaleYContinuous breaks={[0, 1, 2, 3, 4, 5]} />
  <GeomDotplot binwidth={0.05} boundary={0} stackdir="up" />
</GGPlot>
Meta
Details
- Family
- Distributions
- Source
dotplot/histodot- Rendering
- SVG
- Techniques
Related