Gallery / Statistical summaries
errorbar
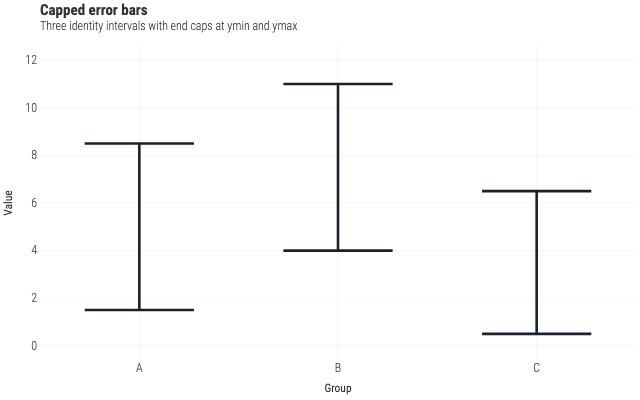
Capped error bars
Three tall identity intervals with end caps — the mark shape that reads at index thumbnail size.
Source
Svelte, builder, JSON
<script lang="ts">
  import {
    GeomErrorbar,
    GGPlot,
    Labs,
    ScaleXDiscrete,
    ScaleYContinuous,
    ThemeMinimal,
  } from "@ggsvelte/svelte";

  import { groupIntervals } from "./data.js";
</script>

<GGPlot
  data={groupIntervals}
  aes={{ x: "group", ymin: "lo", ymax: "hi" }}
  width={640}
  height={400}
>
  <ThemeMinimal />
  <ScaleXDiscrete domain={["A", "B", "C"]} />
  <ScaleYContinuous limits={[0, 12]} />
  <Labs
    title="Capped error bars"
    subtitle="Three identity intervals with end caps at ymin and ymax"
    x="Group"
    y="Value"
  />
  <GeomErrorbar
    width={0.55}
    linewidth={2.6}
    aes={{ color: { value: "#1a202c" } }}
  />
</GGPlot>
Meta
Details
- Family
- Statistical summaries
- Source
errorbar/caps- Rendering
- SVG
- Techniques
Related