Gallery / Points & scatter
point
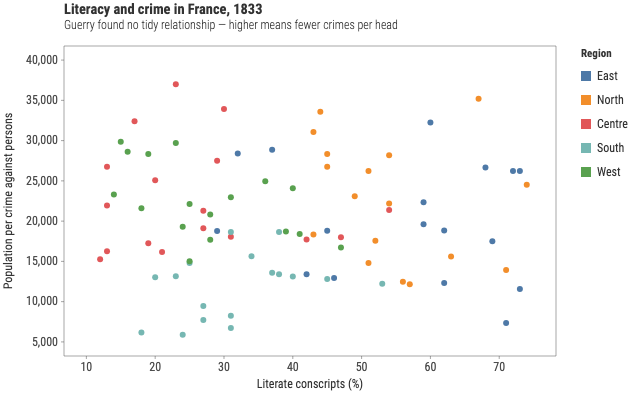
Literacy and crime in France, 1833
Guerry's 86 departments, coloured by region. His uncomfortable finding was that more literate departments did not have less crime.
Source
Svelte, builder, JSON
<script lang="ts">
  import {
    GeomPoint,
    GGPlot,
    Labs,
    ScaleColorDiscrete,
    ThemeFew,
  } from "@ggsvelte/svelte";

  import { guerry } from "./data.js";
</script>

<GGPlot
  data={guerry}
  aes={{ x: "literacy", y: "crimePersons", color: "region" }}
  key="department"
  legendFocus
  width={640}
  height={400}
>
  <ThemeFew />
  <ScaleColorDiscrete scheme="tableau10" />
  <Labs
    title="Literacy and crime in France, 1833"
    subtitle="Guerry found no tidy relationship — higher means fewer crimes per head"
    x="Literate conscripts (%)"
    y="Population per crime against persons"
    color="Region"
  />
  <GeomPoint size={3} />
</GGPlot>
Meta
Details
- Family
- Points & scatter
- Source
point/scatter-color- Rendering
- SVG
- Techniques
Related