Gallery / Rectangles & grids
raster
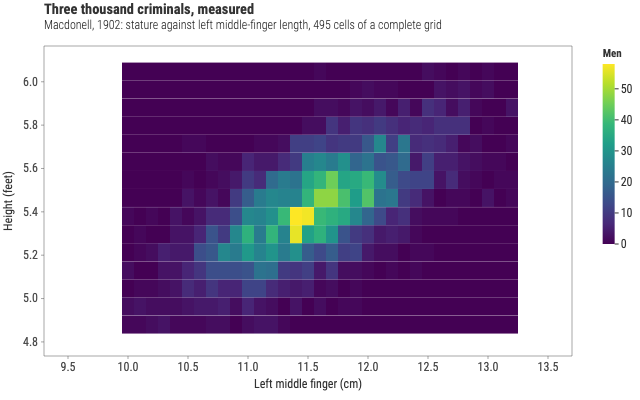
Three thousand criminals, measured
Macdonell's 1902 table of stature against left middle finger length as a complete regular grid, which is what geom_raster needs to work.
Source
Svelte, builder, JSON
<script lang="ts">
  import {
    GeomRaster,
    GGPlot,
    Labs,
    ScaleFillContinuous,
    ThemeFew,
  } from "@ggsvelte/svelte";

  import { criminalStature } from "./data.js";
</script>

<GGPlot
  data={criminalStature}
  aes={{ x: "finger", y: "height", fill: "men" }}
  width={640}
  height={400}
>
  <ThemeFew />
  <ScaleFillContinuous scheme="viridis" />
  <Labs
    title="Three thousand criminals, measured"
    subtitle="Macdonell, 1902: stature against left middle-finger length, 495 cells of a complete grid"
    x="Left middle finger (cm)"
    y="Height (feet)"
    fill="Men"
  />
  <GeomRaster />
</GGPlot>
Meta
Details
- Family
- Rectangles & grids
- Source
raster/grid- Rendering
- SVG
- Techniques
Related