Gallery / Annotations & rules
rule
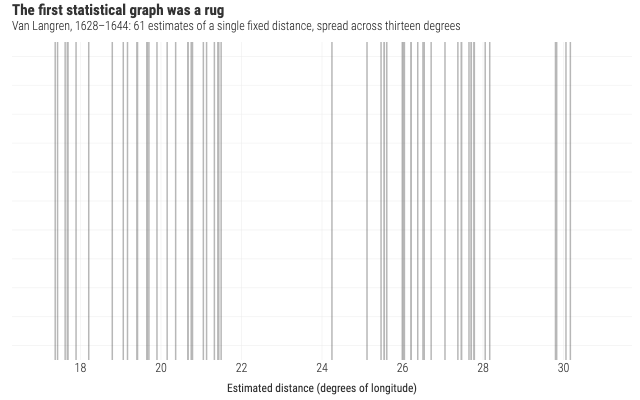
The first statistical graph was a rug
Van Langren's 1644 longitude estimates, one rule per determination, which is the form his own chart took.
Source
Svelte, builder, JSON
<script lang="ts">
  import {
    GeomRule,
    GGPlot,
    GuideNone,
    Labs,
    ThemeMinimal,
  } from "@ggsvelte/svelte";

  import { longitudeEstimates } from "./data.js";
</script>

<GGPlot
  data={longitudeEstimates}
  aes={{ x: "longitude" }}
  width={640}
  height={400}
>
  <ThemeMinimal />
  <Labs
    title="The first statistical graph was a rug"
    subtitle="Van Langren, 1628–1644: 61 estimates of a single fixed distance, spread across thirteen degrees"
    x="Estimated distance (degrees of longitude)"
  />
  <!-- y is synthetic for panel-spanning vertical rules; hide the 0–1 ladder (#700) -->
  <GuideNone channel="y" />
  <GeomRule alpha={0.35} linewidth={1.5} />
</GGPlot>
Meta
Details
- Family
- Annotations & rules
- Source
rule/data-driven- Rendering
- SVG
- Techniques
Related