Gallery / Areas
area
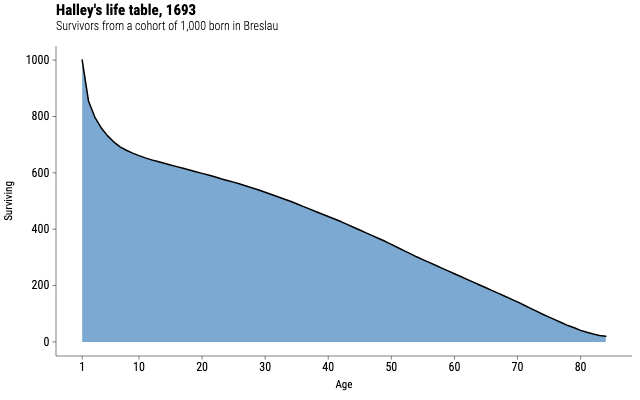
Halley's life table, 1693
Survivors from a cohort of a thousand born in Breslau, drawn as the filled area the first life table implies.
Source
Svelte, builder, JSON
<script lang="ts">
  import {
    GeomArea,
    GeomLine,
    GGPlot,
    Labs,
    ScaleXContinuous,
    ScaleYContinuous,
    ThemeClassic,
  } from "@ggsvelte/svelte";

  import { halleyLifeTable } from "./data.js";
</script>

<GGPlot
  data={halleyLifeTable}
  aes={{ x: "age", y: "survivors" }}
  width={640}
  height={400}
>
  <ThemeClassic />
  <ScaleXContinuous breaks={[1, 10, 20, 30, 40, 50, 60, 70, 80]} nice={false} />
  <ScaleYContinuous breaks={[0, 200, 400, 600, 800, 1000]} />
  <Labs
    title="Halley's life table, 1693"
    subtitle="Survivors from a cohort of 1,000 born in Breslau"
    x="Age"
    y="Surviving"
  />
  <GeomArea alpha={0.7} />
  <GeomLine linewidth={1.5} />
</GGPlot>
Meta
Details
- Family
- Areas
- Source
area/basic- Rendering
- SVG
- Techniques
Related