Gallery / Areas
area
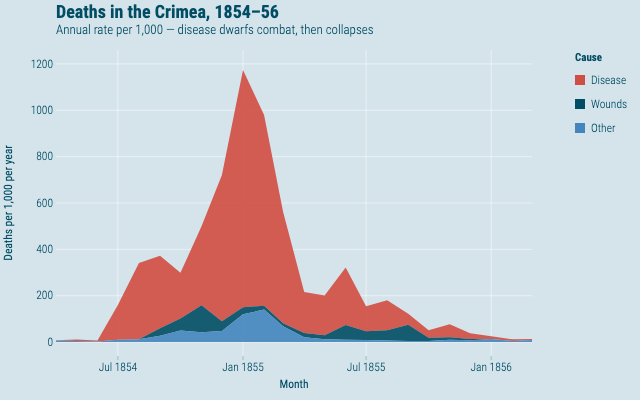
Deaths in the Crimea, 1854 to 1856
Nightingale's monthly army deaths split by cause. Disease dwarfs combat until the Sanitary Commission arrives, then collapses.
Source
Svelte, builder, JSON
<script lang="ts">
  import {
    GeomArea,
    GGPlot,
    Labs,
    ScaleFillManual,
    ScaleXDate,
    ThemeEconomist,
  } from "@ggsvelte/svelte";

  import { crimeanMortality } from "./data.js";
</script>

<GGPlot
  data={crimeanMortality}
  aes={{ x: "month", y: "deaths", fill: "cause" }}
  key={(row) => `${row.month}:${row.cause}`}
  legendFocus
  width={640}
  height={400}
>
  <ThemeEconomist />
  <ScaleXDate labels="%b %Y" />
  <ScaleFillManual
    domain={["Disease", "Wounds", "Other"]}
    values={["#d14d41", "#014d64", "#4385be"]}
  />
  <Labs
    title="Deaths in the Crimea, 1854–56"
    subtitle="Annual rate per 1,000 — disease dwarfs combat, then collapses"
    x="Month"
    y="Deaths per 1,000 per year"
    fill="Cause"
  />
  <GeomArea alpha={0.9} />
</GGPlot>
Meta
Details
- Family
- Areas
- Source
area/stacked- Rendering
- SVG
- Techniques
Related