Gallery / Bars & columns
bar
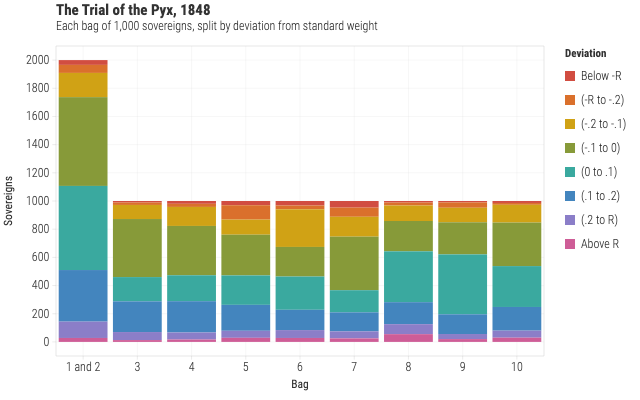
The Trial of the Pyx, 1848
Ten thousand gold sovereigns drawn from the Royal Mint and weighed, each bag stacked by how far its coins deviated from the standard.
Source
Svelte, builder, JSON
<script lang="ts">
  import {
    GeomBar,
    GGPlot,
    Labs,
    ScaleFillDiscrete,
    ScaleXDiscrete,
    ThemeLight,
  } from "@ggsvelte/svelte";

  import { pyxTrial } from "./data.js";
</script>

<GGPlot
  data={pyxTrial}
  aes={{ x: "bag", fill: "deviation", weight: "count" }}
  key={(row) => `${row.bag}:${row.deviation}`}
  legendFocus
  width={640}
  height={400}
>
  <ThemeLight />
  <ScaleXDiscrete
    domain={["1 and 2", "3", "4", "5", "6", "7", "8", "9", "10"]}
  />
  <ScaleFillDiscrete
    domain={[
      "Below -R",
      "(-R to -.2)",
      "(-.2 to -.1)",
      "(-.1 to 0)",
      "(0 to .1)",
      "(.1 to .2)",
      "(.2 to R)",
      "Above R",
    ]}
    scheme="flexoki"
  />
  <Labs
    title="The Trial of the Pyx, 1848"
    subtitle="Each bag of 1,000 sovereigns, split by deviation from standard weight"
    x="Bag"
    y="Sovereigns"
    fill="Deviation"
  />
  <GeomBar />
</GGPlot>
Meta
Details
- Family
- Bars & columns
- Source
bar/stacked- Rendering
- SVG
- Techniques
Related