Gallery / Bars & columns
col
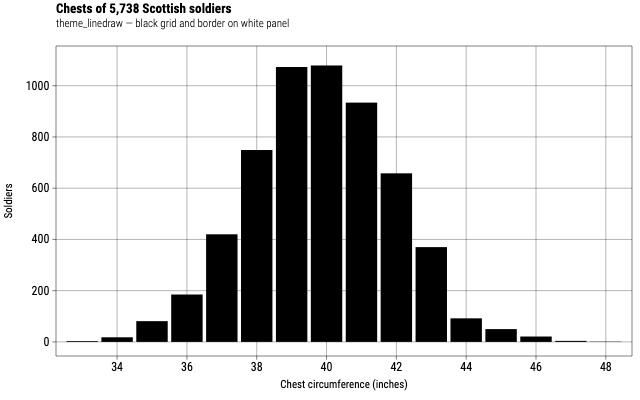
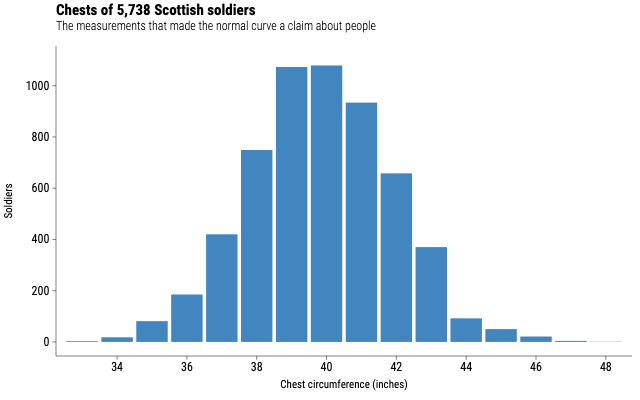
Chests of 5,738 Scottish soldiers
The measurements Quetelet used to argue that human variation follows the astronomers' error curve, and so the data behind the average man.
Source
Svelte, builder, JSON
<script lang="ts">
  import {
    GeomCol,
    GGPlot,
    Labs,
    ScaleXContinuous,
    ThemeClassic,
  } from "@ggsvelte/svelte";

  import { chestSizes } from "./data.js";
</script>

<GGPlot
  data={chestSizes}
  aes={{ x: "chest", y: "soldiers" }}
  width={640}
  height={400}
>
  <ThemeClassic />
  <ScaleXContinuous nice={false} />
  <Labs
    title="Chests of 5,738 Scottish soldiers"
    subtitle="The measurements that made the normal curve a claim about people"
    x="Chest circumference (inches)"
    y="Soldiers"
  />
  <GeomCol />
</GGPlot>
Meta
Details
- Family
- Bars & columns
- Source
col/basic- Rendering
- SVG
- Techniques
Related