Gallery / Bars & columns
col
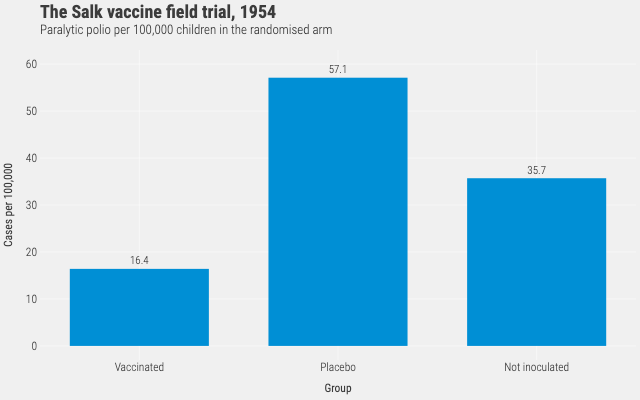
The Salk vaccine field trial, 1954
Paralytic polio per 100,000 children in the randomised arm, with the rate printed on each column because that number is the result.
Source
Svelte, builder, JSON
<script lang="ts">
  import {
    GeomCol,
    GeomText,
    GGPlot,
    Labs,
    ScaleXDiscrete,
    ThemeFivethirtyeight,
  } from "@ggsvelte/svelte";

  import { polioTrial } from "./data.js";
</script>

<GGPlot
  data={polioTrial}
  aes={{ x: "group", y: "rate" }}
  width={640}
  height={400}
>
  <ThemeFivethirtyeight />
  <ScaleXDiscrete domain={["Vaccinated", "Placebo", "Not inoculated"]} />
  <Labs
    title="The Salk vaccine field trial, 1954"
    subtitle="Paralytic polio per 100,000 children in the randomised arm"
    x="Group"
    y="Cases per 100,000"
  />
  <GeomCol width={0.7} />
  <GeomText aes={{ label: "label" }} dy={-8} />
</GGPlot>
Meta
Details
- Family
- Bars & columns
- Source
col/value-labels- Rendering
- SVG
- Techniques
Related