Gallery / Lines & rules
curve
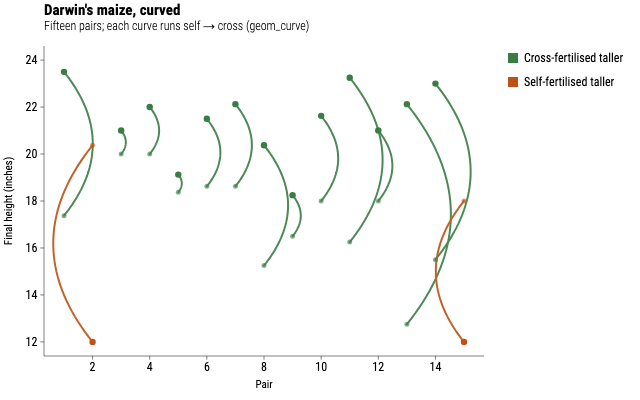
Darwin's maize, curved
Fifteen pairs of seedlings, one cross-fertilised and one self-fertilised, joined by a curve running from the self-fertilised height to the crossed one.
Source
Svelte, builder, JSON
<script lang="ts">
  import {
    GeomCurve,
    GeomPoint,
    GGPlot,
    Labs,
    ScaleColorManual,
    ThemeClassic,
  } from "@ggsvelte/svelte";

  import { darwinMaize } from "./data.js";
</script>

<GGPlot
  data={darwinMaize}
  aes={{ x: "pair", y: "self", xend: "pair", yend: "cross", color: "winner" }}
  width={640}
  height={400}
>
  <ThemeClassic />
  <ScaleColorManual
    domain={["Cross-fertilised taller", "Self-fertilised taller"]}
    values={["#3a7d44", "#bc5215"]}
  />
  <Labs
    title="Darwin's maize, curved"
    subtitle="Fifteen pairs; each curve runs self → cross (geom_curve)"
    x="Pair"
    y="Final height (inches)"
    color=""
  />
  <GeomCurve linewidth={2} lineend="round" curvature={0.4} alpha={0.9} />
  <GeomPoint size={2.5} alpha={0.6} />
  <GeomPoint aes={{ x: "pair", y: "cross" }} size={3.2} />
</GGPlot>
Meta
Details
- Family
- Lines & rules
- Source
curve/connectors- Rendering
- SVG
- Techniques
Related