Gallery / Facets
facet
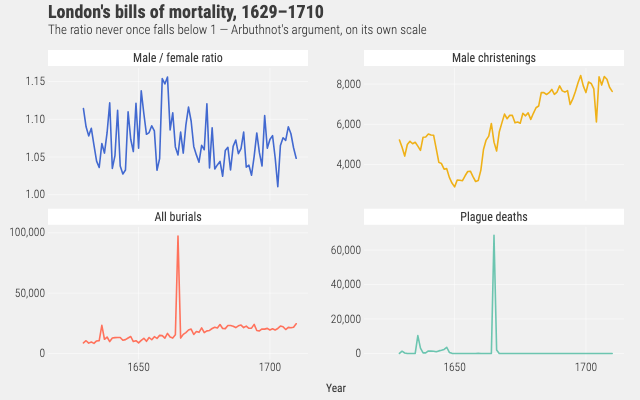
London's bills of mortality, 1629 to 1710
Arbuthnot's christenings and burials with each panel on its own y scale, so a series that spans a different range still shows its shape.
Source
Svelte, builder, JSON
<script lang="ts">
  import {
    FacetWrap,
    GeomLine,
    GGPlot,
    GuideNone,
    Labs,
    ScaleXContinuous,
    ThemeFivethirtyeight,
  } from "@ggsvelte/svelte";

  import { londonBills } from "./data.js";
</script>

<GGPlot
  data={londonBills}
  aes={{ x: "year", y: "value", color: "measure" }}
  width={640}
  height={400}
>
  <ThemeFivethirtyeight />
  <FacetWrap
    field={{
      field: "measure",
      levels: [
        "Male / female ratio",
        "Male christenings",
        "All burials",
        "Plague deaths",
      ],
    }}
    ncol={2}
    scales="free_y"
  />
  <ScaleXContinuous labels="d" />
  <GuideNone channel="color" />
  <Labs
    title="London's bills of mortality, 1629–1710"
    subtitle="The ratio never once falls below 1 — Arbuthnot's argument, on its own scale"
    x="Year"
    y=""
  />
  <GeomLine linewidth={1.6} />
</GGPlot>
Meta
Details
- Family
- Facets
- Source
facet/wrap-free-y- Rendering
- SVG
- Techniques
Related