Gallery / Points & scatter
jitter
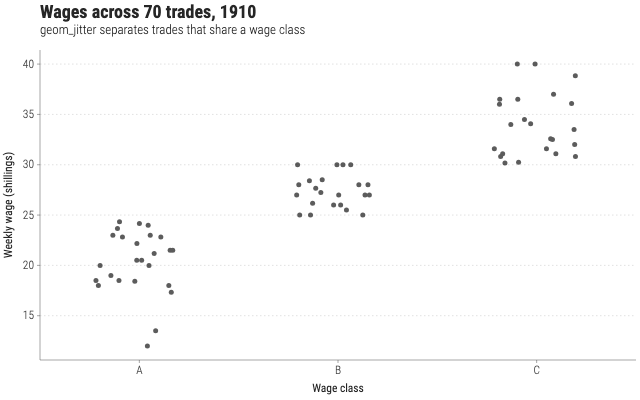
Wages across 70 trades, 1910
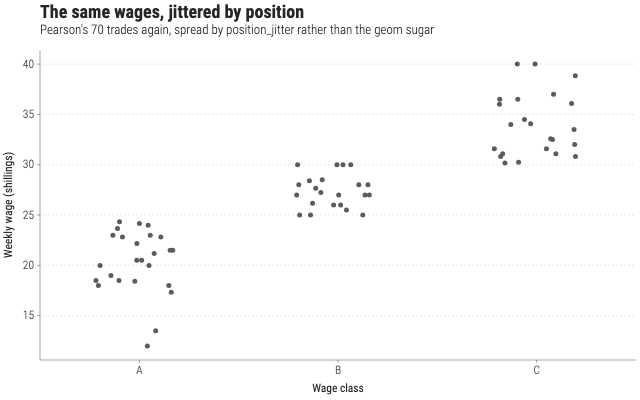
Pearson's study of drink and wages. The trades share a handful of wage classes, so jitter is what separates them into readable marks.
Source
Svelte, builder, JSON
<script lang="ts">
  import { GeomJitter, GGPlot, Labs, ThemeClean } from "@ggsvelte/svelte";

  import { drinksWages } from "./data.js";
</script>

<GGPlot
  data={drinksWages}
  aes={{ x: "wageClass", y: "wage" }}
  width={640}
  height={400}
>
  <ThemeClean />
  <Labs
    title="Wages across 70 trades, 1910"
    subtitle="geom_jitter separates trades that share a wage class"
    x="Wage class"
    y="Weekly wage (shillings)"
  />
  <GeomJitter width={0.22} height={0} alpha={0.75} />
</GGPlot>
Meta
Details
- Family
- Points & scatter
- Source
jitter/basic- Rendering
- SVG
- Techniques
Related