Gallery / Points & scatter
point
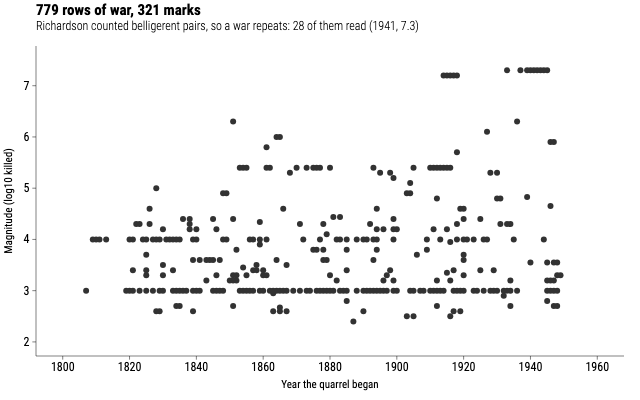
779 rows of war, 321 marks
Richardson recorded one row per pair of belligerents, so a large war repeats itself - 28 of the Second World War's pairs read the same year and death toll. Keeping the first row per position draws each once.
Source
Svelte, builder, JSON
<script lang="ts">
  import { GeomPoint, GGPlot, Labs, ThemeClassic } from "@ggsvelte/svelte";

  import { deadlyQuarrels } from "./data.js";
</script>

<GGPlot
  data={deadlyQuarrels}
  aes={{ x: "year", y: "magnitude" }}
  width={640}
  height={400}
>
  <ThemeClassic />
  <Labs
    title="779 rows of war, 321 marks"
    subtitle="Richardson counted belligerent pairs, so a war repeats: 28 of them read (1941, 7.3)"
    x="Year the quarrel began"
    y="Magnitude (log10 killed)"
  />
  <GeomPoint stat="unique" size={3} alpha={0.8} />
</GGPlot>
Meta
Details
- Family
- Points & scatter
- Source
point/stat-unique- Rendering
- SVG
- Techniques
Related