Gallery / Points & scatter
point
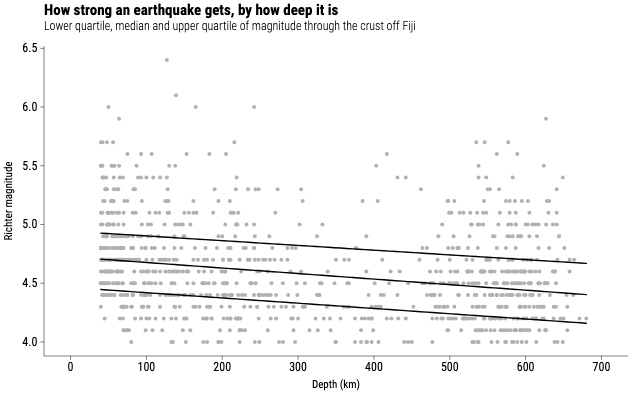
Earthquake strength by depth
A thousand events off Fiji with the quartiles of magnitude fitted through them. Quantile lines describe the spread, not just where the middle sits.
Source
Svelte, builder, JSON
<script lang="ts">
  import {
    GeomPoint,
    GeomQuantile,
    GGPlot,
    Labs,
    ThemeClassic,
  } from "@ggsvelte/svelte";

  import { fijiQuakes } from "./data.js";
</script>

<GGPlot
  data={fijiQuakes}
  aes={{ x: "depth", y: "mag" }}
  width={640}
  height={400}
>
  <ThemeClassic />
  <Labs
    title="How strong an earthquake gets, by how deep it is"
    subtitle="Lower quartile, median and upper quartile of magnitude through the crust off Fiji"
    x="Depth (km)"
    y="Richter magnitude"
  />
  <GeomPoint alpha={0.3} size={2} />
  <GeomQuantile linewidth={1.4} />
</GGPlot>
Meta
Details
- Family
- Points & scatter
- Source
point/quantile-lines- Rendering
- SVG
- Techniques
Related