Gallery / Lines & time
line
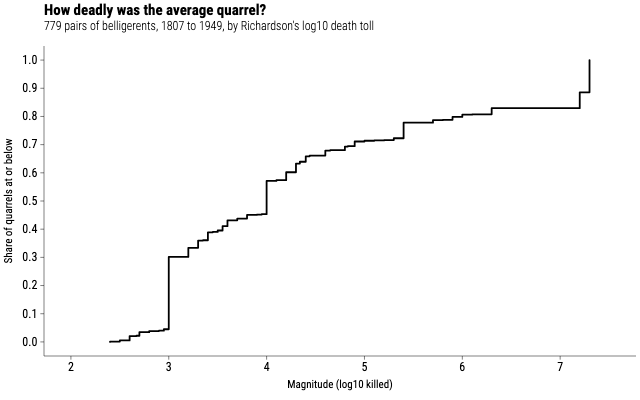
Richardson's deadly quarrels
The empirical distribution of 779 conflicts by magnitude, the log10 of the death toll. The median quarrel killed about ten thousand people.
Source
Svelte, builder, JSON
<script lang="ts">
  import { GeomLine, GGPlot, Labs, ThemeClassic } from "@ggsvelte/svelte";

  import { deadlyQuarrels } from "./data.js";
</script>

<GGPlot data={deadlyQuarrels} aes={{ x: "magnitude" }} width={640} height={400}>
  <ThemeClassic />
  <Labs
    title="How deadly was the average quarrel?"
    subtitle="779 pairs of belligerents, 1807 to 1949, by Richardson's log10 death toll"
    x="Magnitude (log10 killed)"
    y="Share of quarrels at or below"
  />
  <GeomLine stat="ecdf" curve="step-hv" linewidth={1.8} pad={true} />
</GGPlot>
Meta
Details
- Family
- Lines & time
- Source
line/ecdf- Rendering
- SVG
- Techniques
Related