Gallery / Lines & rules
line
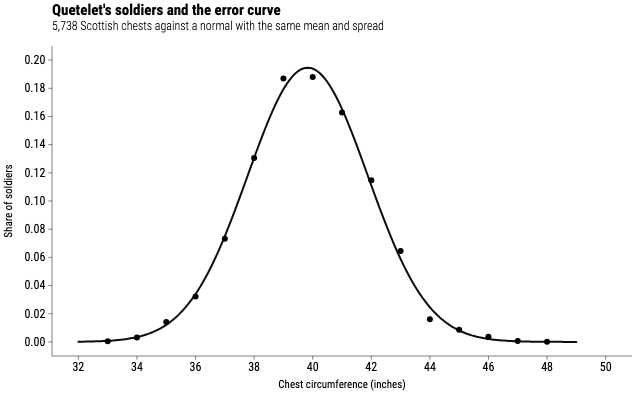
Quetelet's soldiers and the error curve
The chest measurements Quetelet used to claim human variation follows the astronomers' error curve, with that curve drawn over them.
Source
Svelte, builder, JSON
<script lang="ts">
  import {
    GeomFunction,
    GeomPoint,
    GGPlot,
    Labs,
    ThemeClassic,
  } from "@ggsvelte/svelte";

  import { chestSizes } from "./data.js";
</script>

<GGPlot data={chestSizes} aes={{ x: "chest" }} width={640} height={400}>
  <ThemeClassic />
  <Labs
    title="Quetelet's soldiers and the error curve"
    subtitle="5,738 Scottish chests against a normal with the same mean and spread"
    x="Chest circumference (inches)"
    y="Share of soldiers"
  />
  <GeomPoint aes={{ y: "share" }} size={3} />
  <GeomFunction
    fun="dnorm"
    n={201}
    xlim={[32, 49]}
    args={{ mean: 39.83, sd: 2.05 }}
    linewidth={2}
    alpha={0.95}
  />
</GGPlot>
Meta
Details
- Family
- Lines & rules
- Source
line/function- Rendering
- SVG
- Techniques
Related