Gallery / Showcase
showcase
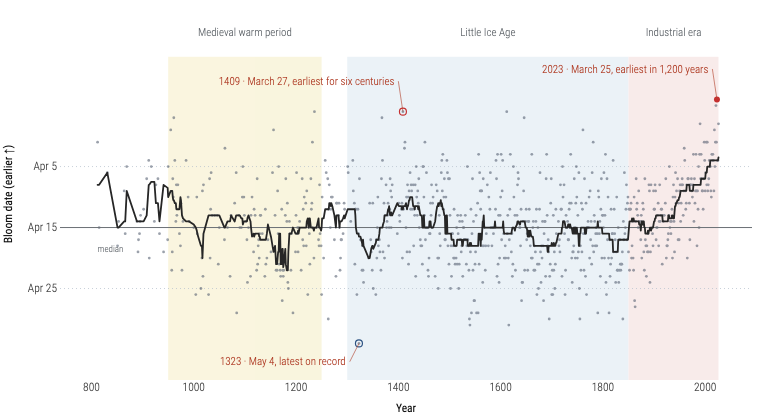
Kyoto cherry blossoms, 812–2026
Tufte's full-bloom chart at full fidelity: 30-year rolling median, epoch bands, labeled baseline, and circled records.
Source
Svelte, builder, JSON
<script lang="ts">
  import {
    GeomLine,
    GeomPoint,
    GeomRect,
    GeomRule,
    GeomSegment,
    GeomText,
    GGPlot,
    GuideNone,
    Labs,
    registerSummaryRolling,
    ScaleFillManual,
    ScaleXContinuous,
    ScaleYMonthDay,
    ThemeTufte,
  } from "@ggsvelte/svelte";
  import { kyotoSakura } from "@ggsvelte/svelte/data";

  // stat="summary_rolling" on the basic GeomLine shell: opt into the family
  // (the shell registers only its default stat, #1420).
  registerSummaryRolling();

  // Bands cover every observation; a strip above holds the epoch names.
  const span = { top: "03-18", bottom: "05-10" };
  const epochs = [
    { epoch: "Medieval warm period", year: 950, until: 1250, ...span },
    { epoch: "Little Ice Age", year: 1300, until: 1850, ...span },
    { epoch: "Industrial era", year: 1850, until: 2026, ...span },
  ];
  const epochNames = epochs.map((band) => ({
    epoch: band.epoch,
    midYear: Math.round((band.year + band.until) / 2),
    nameDate: "03-14",
  }));

  const records = [
    {
      year: 1323,
      bloomDate: "05-04",
      label: "1323 · May 4, latest on record",
      labelYear: 1305,
      labelDate: "05-07",
    },
    {
      year: 1409,
      bloomDate: "03-27",
      label: "1409 · March 27, earliest for six centuries",
      labelYear: 1400,
      labelDate: "03-22",
    },
    {
      year: 2023,
      bloomDate: "03-25",
      label: "2023 · March 25, earliest in 1,200 years",
      labelYear: 2014,
      labelDate: "03-20",
    },
  ];
  const baselineLabel = [{ year: 812, bloomDate: "04-15", label: "median" }];

  // Ring treatment from the reference: an open blue ring on the latest bloom,
  // an open red ring on the earliest, a filled red dot on the modern record.
  const ringLatest = [{ year: 1323, bloomDate: "05-04" }];
  const ringEarliest = [{ year: 1409, bloomDate: "03-27" }];
  const recordRecent = [{ year: 2023, bloomDate: "03-25" }];
</script>

<GGPlot
  data={kyotoSakura}
  aes={{ x: "year", y: "bloomDate" }}
  width={768}
  height={420}
>
  <ThemeTufte />
  <ScaleXContinuous labels="d" domain={[800, 2030]} />
  <ScaleYMonthDay
    reverse
    breaks={["04-05", "04-15", "04-25"]}
    dateLabels="%b %e"
    domain={["05-10", "03-10"]}
  />
  <ScaleFillManual
    domain={["Medieval warm period", "Little Ice Age", "Industrial era"]}
    values={["#f5edc4", "#dce8f2", "#f3dcda"]}
  />
  <GuideNone channel="fill" />
  <Labs x="Year" y="Bloom date (earlier ↑)" />
  <GeomRect
    data={epochs}
    aes={{
      x: null,
      y: null,
      xmin: "year",
      xmax: "until",
      ymin: "top",
      ymax: "bottom",
      fill: "epoch",
    }}
    alpha={0.55}
    inspect={false}
  />
  <GeomText
    data={epochNames}
    aes={{
      x: "midYear",
      y: "nameDate",
      label: "epoch",
      color: { value: "#6b7075" },
    }}
    size={11}
    inspect={false}
  />
  <GeomRule
    yintercept="04-05"
    linewidth={0.75}
    aes={{ color: { value: "#b7c1cd" }, linetype: { value: "dotted" } }}
    inspect={false}
  />
  <GeomRule
    yintercept="04-25"
    linewidth={0.75}
    aes={{ color: { value: "#b7c1cd" }, linetype: { value: "dotted" } }}
    inspect={false}
  />
  <GeomPoint alpha={0.55} size={1.4} aes={{ color: { value: "#4a5568" } }} />
  <GeomRule
    yintercept="04-15"
    linewidth={1}
    aes={{ color: { value: "#6b7075" } }}
    inspect={false}
  />
  <GeomText
    data={baselineLabel}
    aes={{
      x: "year",
      y: "bloomDate",
      label: "label",
      color: { value: "#6b7075" },
    }}
    size={9}
    anchor="start"
    dy={22}
    inspect={false}
  />
  <GeomLine
    stat="summary_rolling"
    fun="median"
    window={30}
    curve="linear"
    linewidth={1.8}
    aes={{ color: { value: "#262626" } }}
  />
  <GeomPoint
    data={ringLatest}
    shape="circle-open"
    size={3.5}
    aes={{ x: "year", y: "bloomDate", color: { value: "#2c5282" } }}
  />
  <GeomPoint
    data={ringEarliest}
    shape="circle-open"
    size={3.5}
    aes={{ x: "year", y: "bloomDate", color: { value: "#c53030" } }}
  />
  <GeomPoint
    data={recordRecent}
    size={3}
    aes={{ x: "year", y: "bloomDate", color: { value: "#c53030" } }}
  />
  <GeomSegment
    data={records}
    aes={{
      x: "labelYear",
      y: "labelDate",
      xend: "year",
      yend: "bloomDate",
      color: { value: "#b3452f" },
    }}
    linewidth={0.7}
    alpha={0.9}
  />
  <GeomText
    data={records}
    aes={{
      x: "labelYear",
      y: "labelDate",
      label: "label",
      color: { value: "#b3452f" },
    }}
    size={11}
    anchor="end"
    dx={-4}
  />
</GGPlot>
Meta
Details
- Family
- Showcase
- Source
showcase/kyoto-sakura- Rendering
- SVG
- Techniques
Related