Gallery / Rectangles & grids
tile
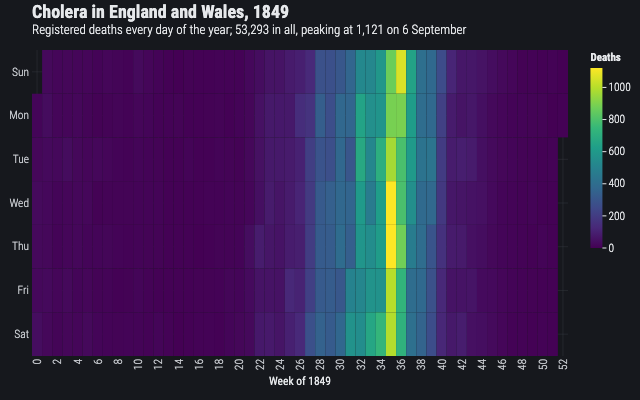
Cholera in England and Wales, 1849
Every day of the epidemic from Farr's weekly returns, laid out as a calendar of tiles so the summer peak reads as a block.
Source
Svelte, builder, JSON
<script lang="ts">
  import {
    GeomTile,
    GGPlot,
    Labs,
    ScaleFillContinuous,
    ScaleXDiscrete,
    ScaleYDiscrete,
    ThemeDark,
  } from "@ggsvelte/svelte";

  import { cholera1849 } from "./data.js";
</script>

<GGPlot
  data={cholera1849}
  aes={{ x: "week", y: "weekday", fill: "deaths" }}
  width={640}
  height={400}
>
  <ThemeDark />
  <ScaleXDiscrete />
  <ScaleYDiscrete domain={["Sat", "Fri", "Thu", "Wed", "Tue", "Mon", "Sun"]} />
  <ScaleFillContinuous scheme="viridis" />
  <Labs
    title="Cholera in England and Wales, 1849"
    subtitle="Registered deaths every day of the year; 53,293 in all, peaking at 1,121 on 6 September"
    x="Week of 1849"
    y=""
    fill="Deaths"
  />
  <GeomTile />
</GGPlot>
Meta
Details
- Family
- Rectangles & grids
- Source
tile/heatmap- Rendering
- SVG
- Techniques
Related