On this page
Geoms
49 geoms
All geoms
-
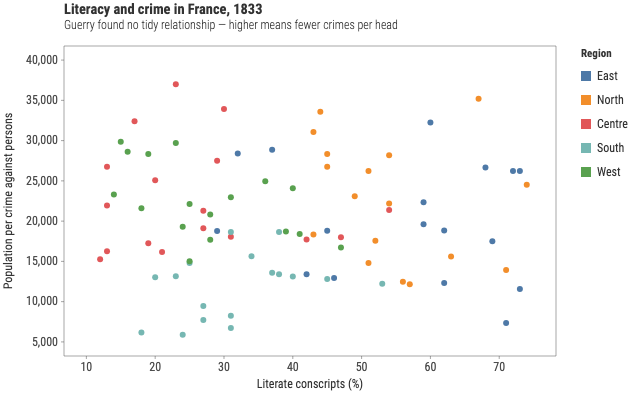
GeomPointPoint geometry: one mark per data row. Use for scatter plots, dot plots, bubbles, and correlation views. -
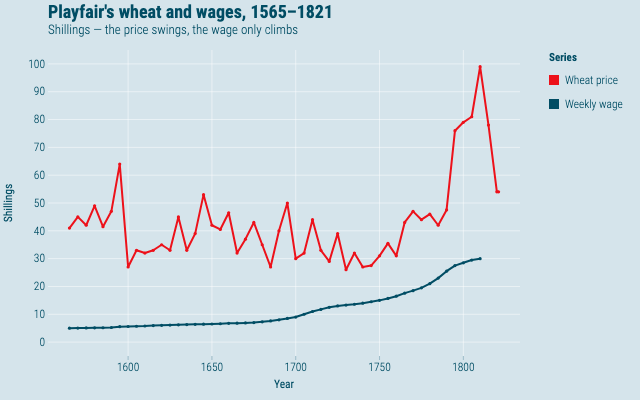
GeomLineLine geometry: connects points in x order, one line per group (groups derive from discrete aesthetics such as color, or from aes.group). Use for time series, trends, and line charts. With stat ecdf, pair with step curves; with stat bin (freqpoly alias), y is computed from counts/density; with stat connect, successive points expand into connection vertices. -
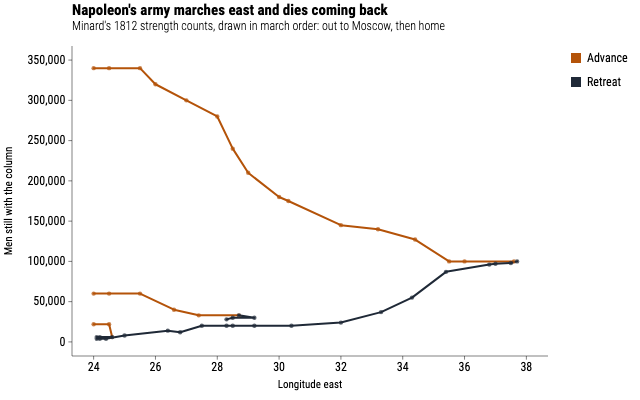
GeomPathPath geometry: connects points in data (row) order within each group — unlike line, which sorts by x. Use for trajectories, loops, connected scatterplots, and ellipse rings (stat ellipse). With stat connect, successive points expand into connection vertices. -
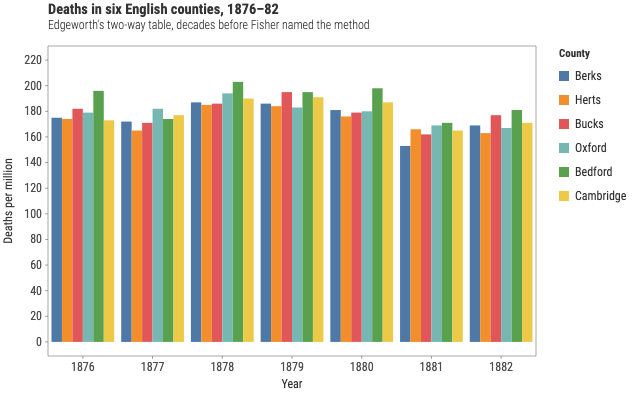
GeomColColumn geometry: one rectangle per data row, from the y baseline (zero) to the row's y value. Use when the data already contains the bar heights — prefer over GeomBar, which counts or bins. -
GeomBarBar geometry with counting or binning: one rectangle per distinct x value (stat count, discrete x) or per bin (stat bin, continuous x). Do not map aes.y — the stat computes it. Prefer GeomCol when bar heights are already in the data. -
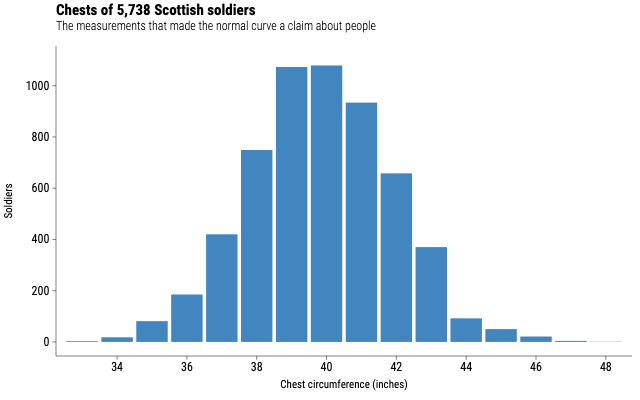
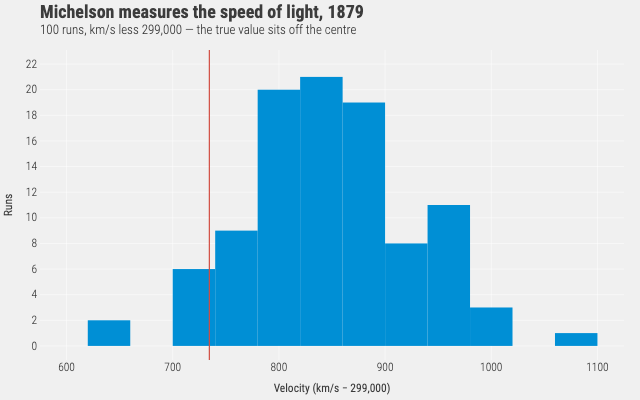
GeomHistogramHistogram geometry: a continuous x variable divided into bins, one bar per bin whose height is the count of rows (or the sum of aes.weight). Do not map aes.y — the bin stat computes it. Canonicalized by normalize() to a bar layer with stat bin. -
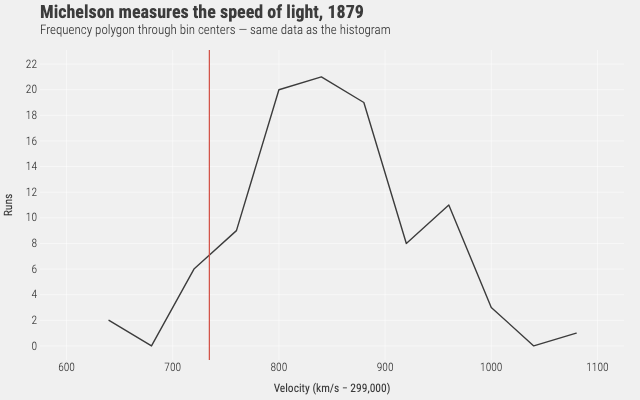
GeomFreqpolyFrequency polygon: continuous x binned like a histogram, drawn as a line through bin centers. Do not map aes.y — the bin stat computes it. Canonicalized by normalize() to a line layer with stat bin. -
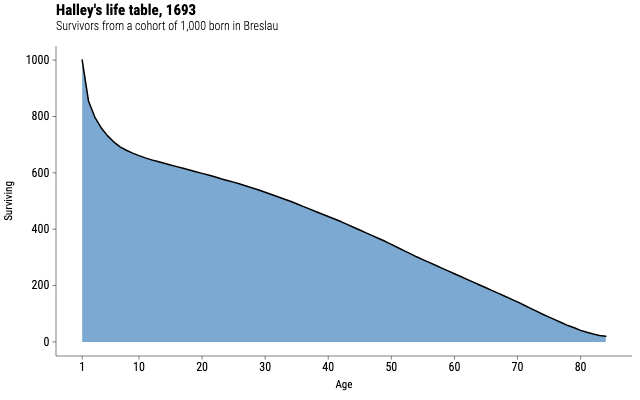
GeomAreaArea geometry: a filled region from the y baseline (zero) to the y value, connected in x order per group. Use for stacked composition-over-time charts. With stat align, series with different x samples share a common grid for stack/fill. -
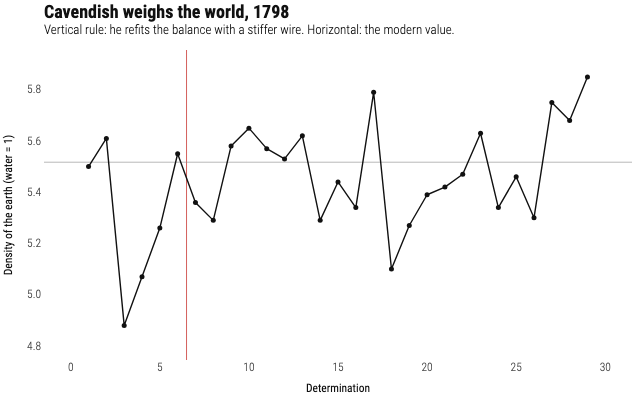
GeomRuleRule geometry: reference lines spanning the panel. Two forms: (1) annotation — set params.xintercept and/or params.yintercept to fixed data values and map neither aes.x nor aes.y; (2) data-driven — map exactly one of aes.x (vertical rules) or aes.y (horizontal rules) to a field. Never mix the forms in one layer. -
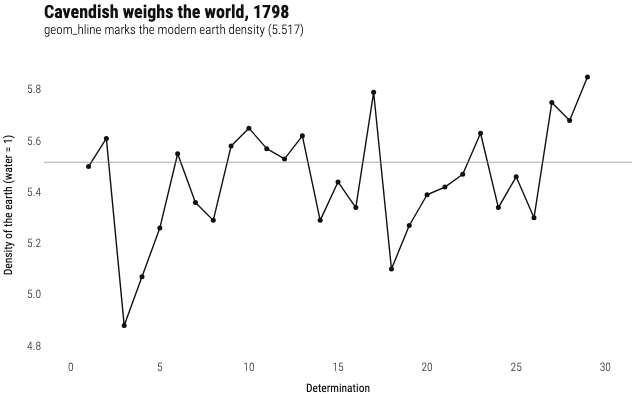
GeomHlineHorizontal reference-line alias. Canonicalized by normalize() to a rule layer. Annotation form: set params.yintercept. Data-driven form: map aes.y (inherited plot x is dropped so the one-axis rule contract holds). -
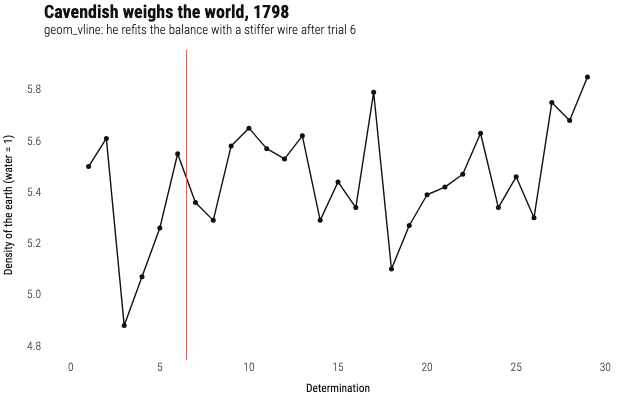
GeomVlineVertical reference-line alias. Canonicalized by normalize() to a rule layer. Annotation form: set params.xintercept. Data-driven form: map aes.x (inherited plot y is dropped so the one-axis rule contract holds). -
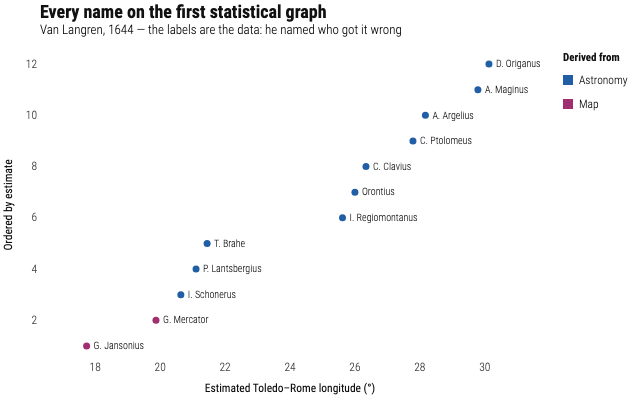
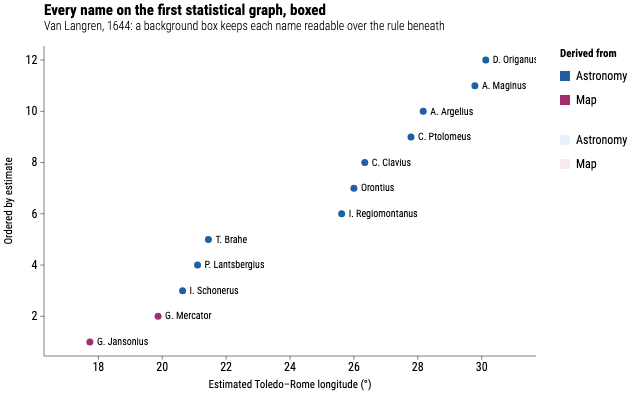
GeomTextText geometry: one label per data row at (x, y). No collision detection — labels draw exactly where placed. Requires x, y, and label channels. -
GeomLabelLabel geometry: text with a rounded rectangular background box. Requires x, y, and label channels. No collision detection. -
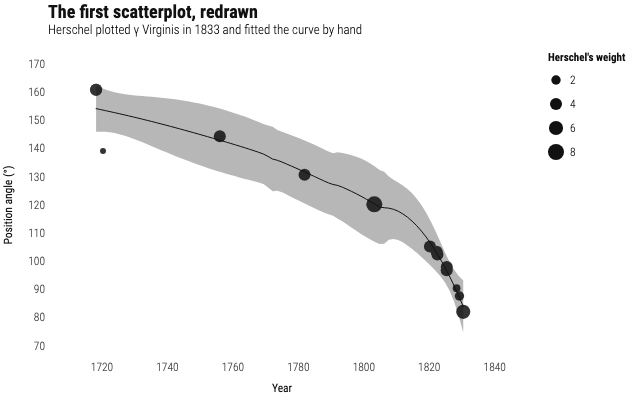
GeomSmoothSmooth geometry: a fitted trend line (with an optional confidence ribbon) over an x/y scatter, one fit per group. Use to reveal trends. -
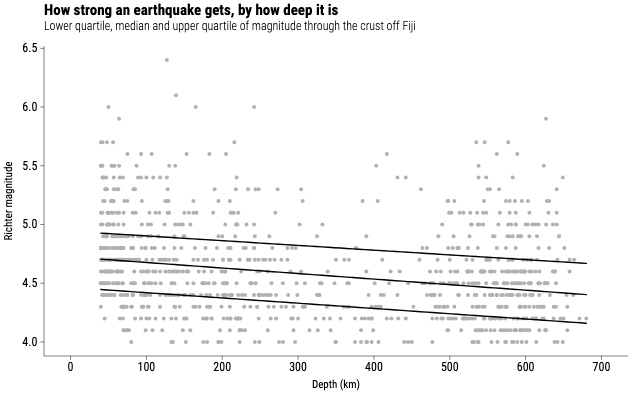
GeomQuantileQuantile geometry: linear quantile regression lines (y ~ x) at one or more conditional quantiles of y, one line per quantile per group. -
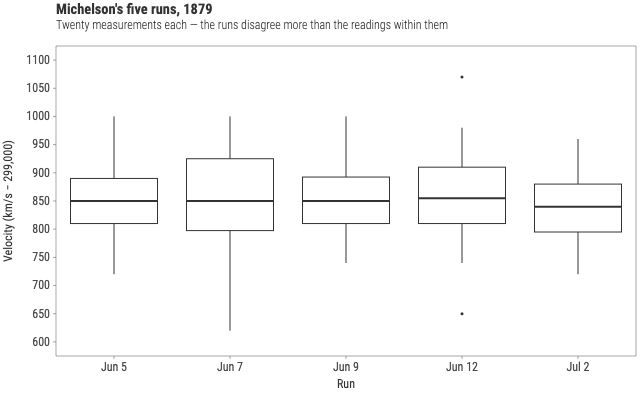
GeomBoxplotBox-and-whisker geometry: one box per x category (per group) summarizing the y distribution — hinges at the quartiles, whiskers to the furthest points within coef × IQR, outliers drawn individually. -
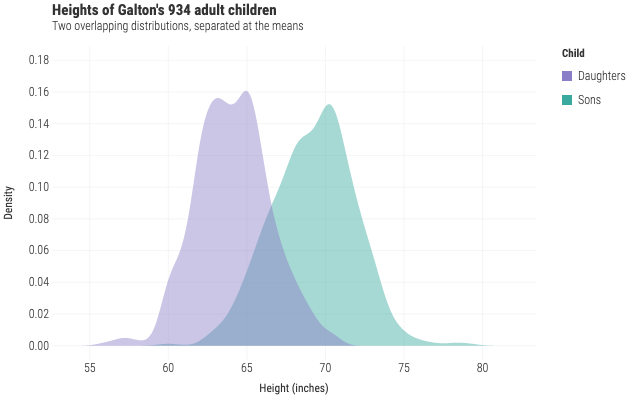
GeomDensityDensity geometry: a smooth kernel density estimate of a continuous x variable, drawn as a filled area — a smoothed histogram alternative. One curve per group. Do NOT map aes.y — the density stat computes it. -
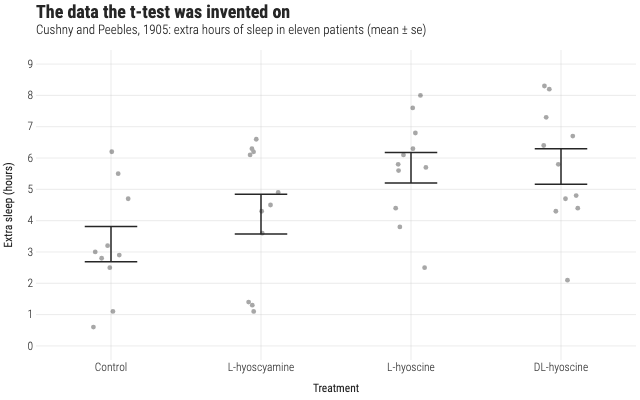
GeomErrorbarErrorbar geometry: a vertical range with caps at ymin and ymax, one per data row (identity stat) or per x group (summary stat). -
GeomLinerangeLinerange geometry: a vertical stem from ymin to ymax without end caps. -
GeomPointrangePointrange geometry: vertical stem from ymin to ymax plus a point at (x, y). -
GeomCrossbarCrossbar geometry: a vertical interval box from ymin to ymax with a mid horizontal line at y. -
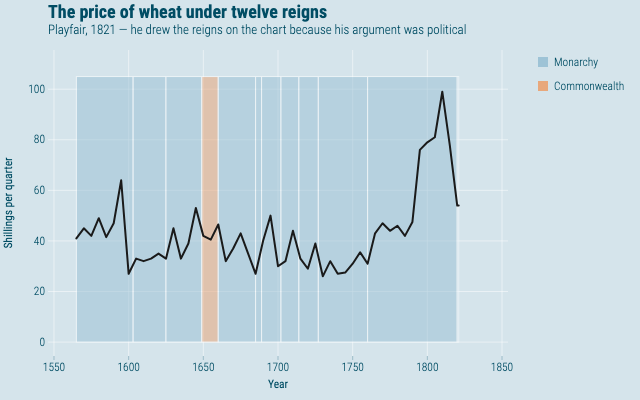
GeomRectRectangle geometry: one rectangle per data row from mapped xmin/xmax/ymin/ymax edges. Use for arbitrary shaded regions and time bands. -
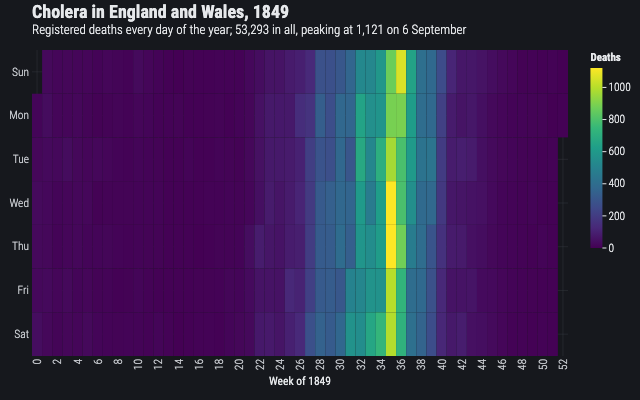
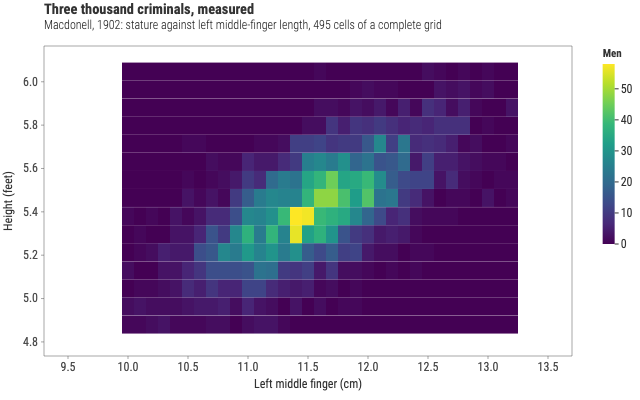
GeomTileTile geometry: center-sized cells at (x, y) with optional width/height. Use for heatmaps and gridded categorical cells; supports stroke outlines. -
GeomRasterRaster geometry: equal-cell grid at (x, y) with fill; optimized dense heatmaps without per-cell strokes. Irregular spacing warns and suggests geom tile. -
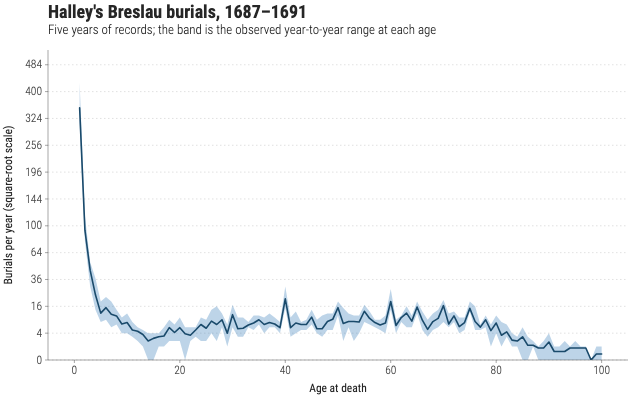
GeomRibbonRibbon geometry: a filled interval between two varying boundaries along a running coordinate. Map x+ymin+ymax (x orientation) or y+xmin+xmax (y orientation). Not a zero-baseline area. -
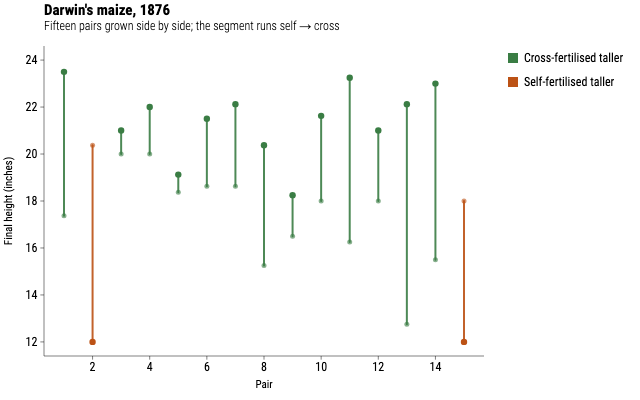
GeomSegmentSegment geometry: one finite line per data row from (x, y) to (xend, yend). Unlike rule, endpoints are data-mapped and do not span the panel. -
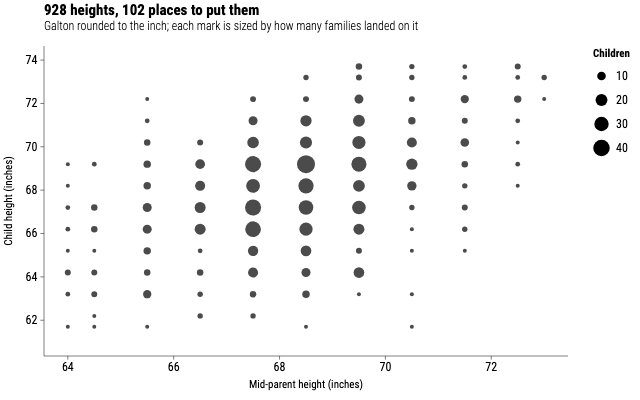
GeomCountCount geometry: point marks at unique (x, y) with size scaled by after_stat n (stat sum). Use for overplotting density on discrete or rounded coordinates. -
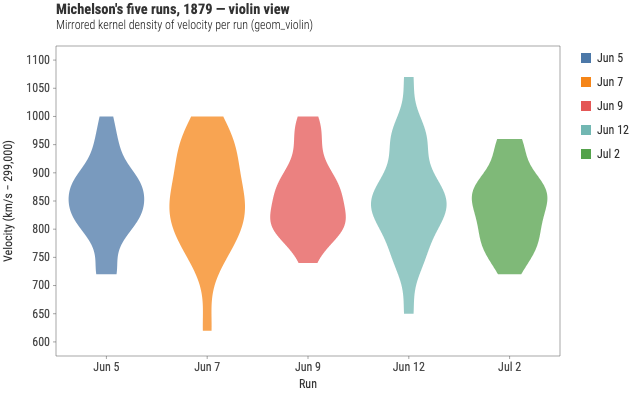
GeomViolinViolin geometry: mirrored kernel density of continuous y at each discrete x (stat ydensity). One polygon per x×group. Default position dodge. -
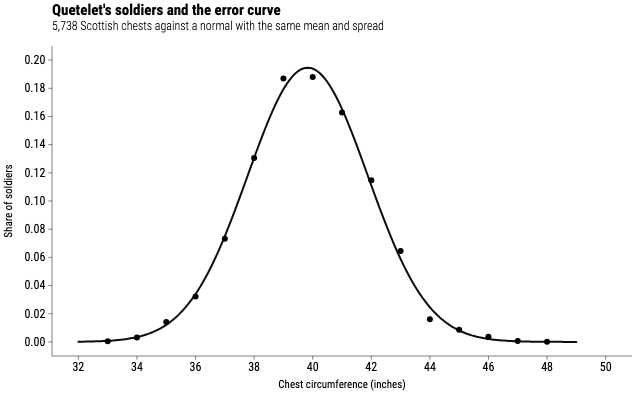
GeomFunctionFunction geometry: evaluate a named portable function y = f(x) on a grid and draw a path. Requires params.fun; domain from params.xlim, mapped x, or peer layers. -
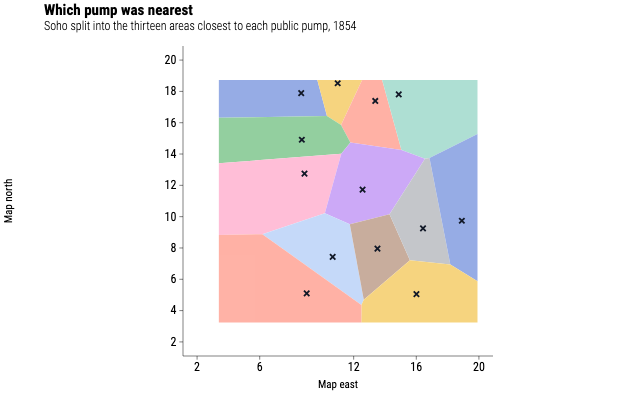
GeomPolygonPolygon geometry: closed filled paths from (x, y) vertices in data/row order within each group. Groups form separate polygons. No x-sort (unlike line/area). Holes/subgroup omitted in v1. -
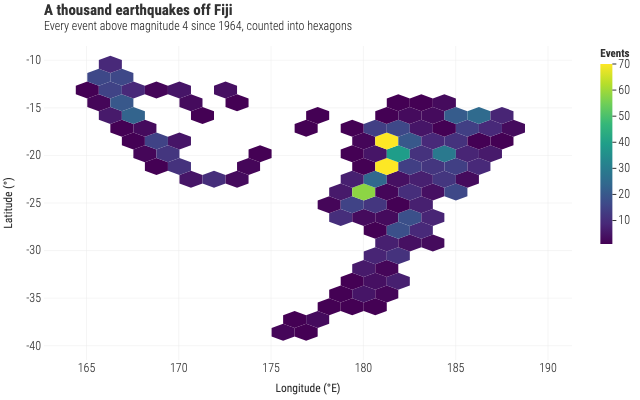
GeomHexHexagonal bin heatmap: partitions continuous x×y into a hexagonal lattice and maps fill to bin count by default. -
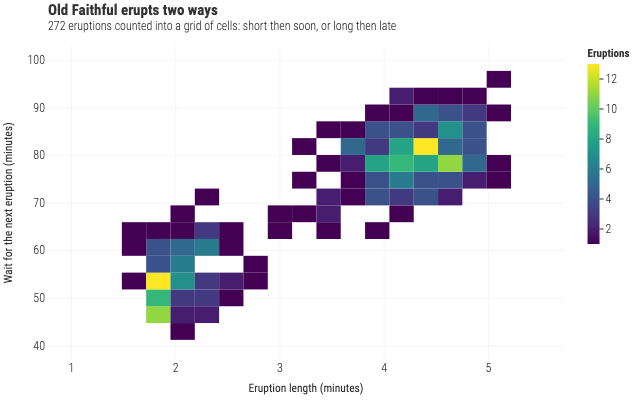
GeomBin2d2D rectangular bin heatmap: partitions continuous x×y into a grid and maps fill to bin count by default. Empty bins are dropped unless params.drop is false. -
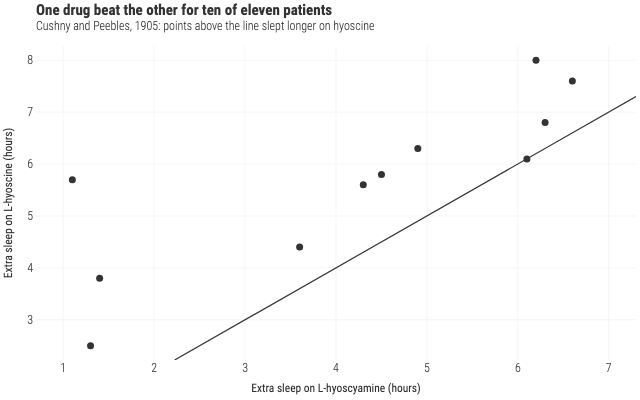
GeomAblineAbline geometry: one infinite reference line y = intercept + slope · x, clipped to the panel. Annotation form: fixed slope/intercept in params; does not inherit plot aes. -
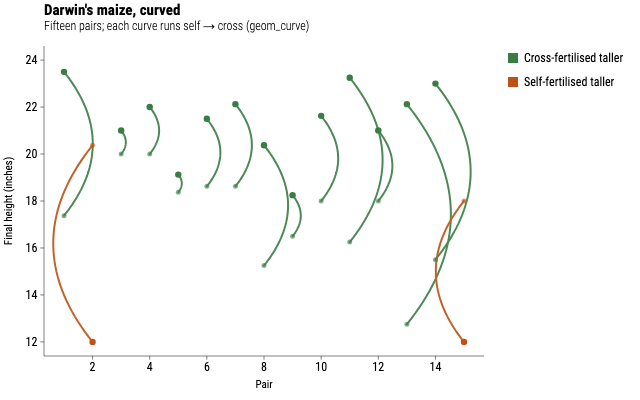
GeomCurveCurve geometry: one curved connector per row from (x, y) to (xend, yend). Tessellated as a quadratic Bezier (curvature/angle/ncp). Requires field-mapped x, y, xend, and yend. -
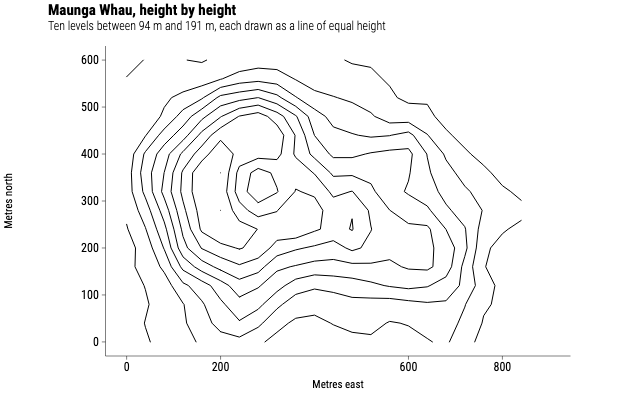
GeomContourContour geometry: isolines of a continuous z surface over a regular x×y grid. v1 draws open path polylines only (not filled bands). -
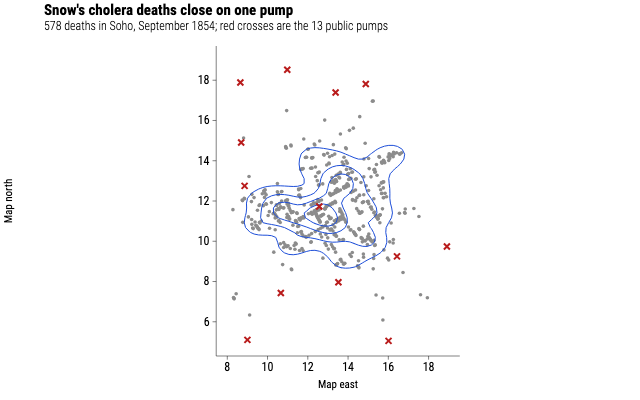
GeomDensity2d2D density geometry: bivariate KDE isolines over continuous x and y. Open path contours. -
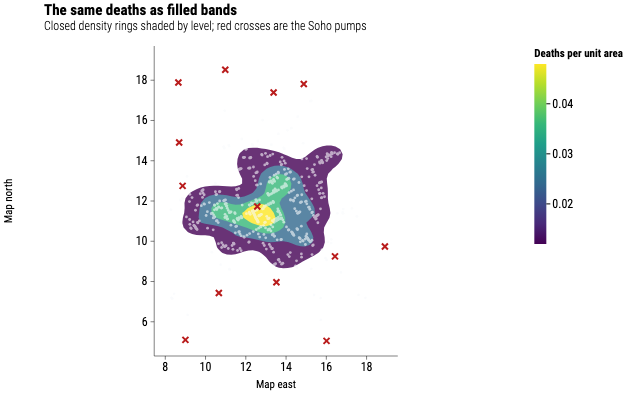
GeomDensity2dFilled2D density filled bands: bivariate KDE closed isoline rings filled by density level. Open rings dropped. Defaults fill to after_stat(level). -
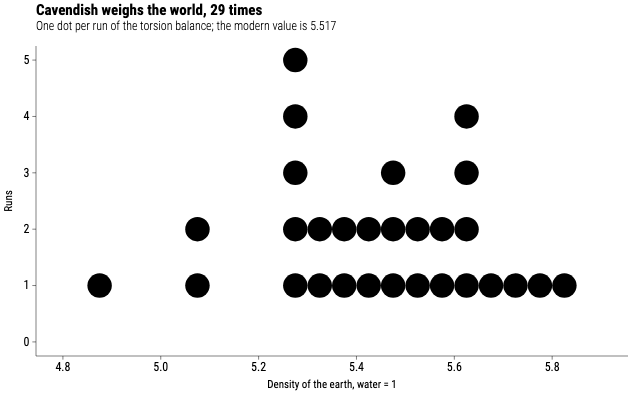
GeomDotplotDotplot geometry: stacked dots along a continuous x axis (histodot subset). Do not map aes.y — the bindot stat computes stack positions. -
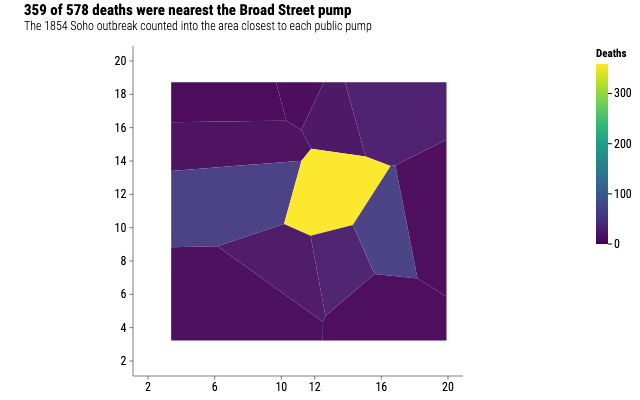
GeomMapMap geometry: join fortified region borders to value rows via aes.map_id and params.map. Renders closed filled paths per region. -
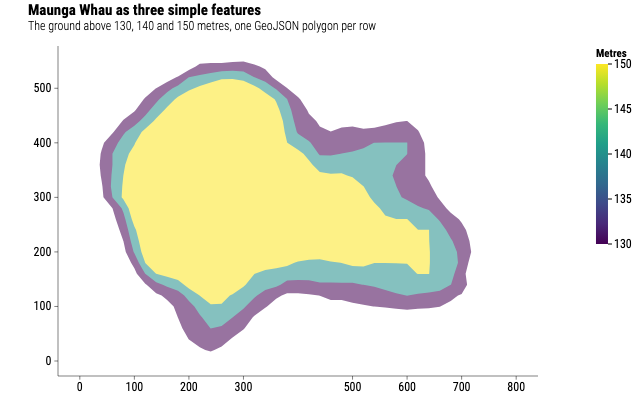
GeomSfSimple-features geometry: already-projected GeoJSON Geometry JSON strings in a data column. Point/line/polygon families (incl. GeometryCollection of one family) with even-odd holes; use coord_sf for fixed-aspect (CRS reproject deferred). -
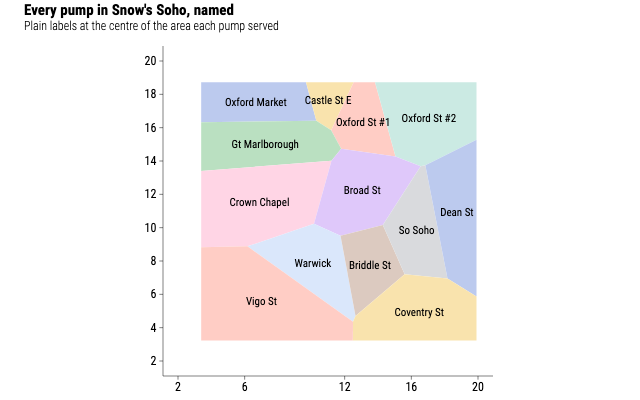
GeomSfTextSimple-features text labels: places aes.label at representative geometry points (Multi* → one label per part; stat_sf_coordinates). -
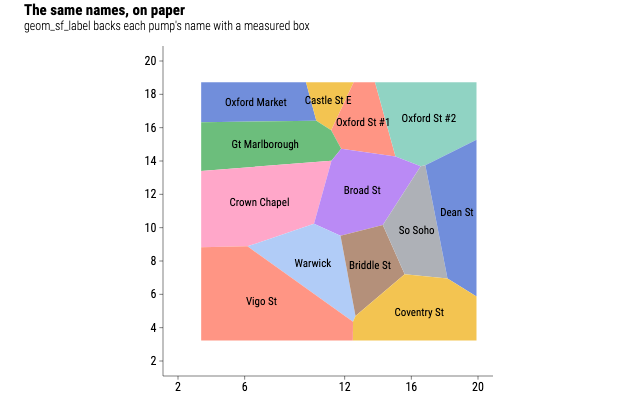
GeomSfLabelSimple-features labels with background boxes: places aes.label at representative geometry points with a measured rounded rect (Multi* → one label per part). color=ink+box stroke; fill=box background. -
GeomBlankBlank geometry: contributes mapped aesthetics to scale training and layout without drawing marks or hit targets. No channels are required; whatever is mapped trains its scale. -
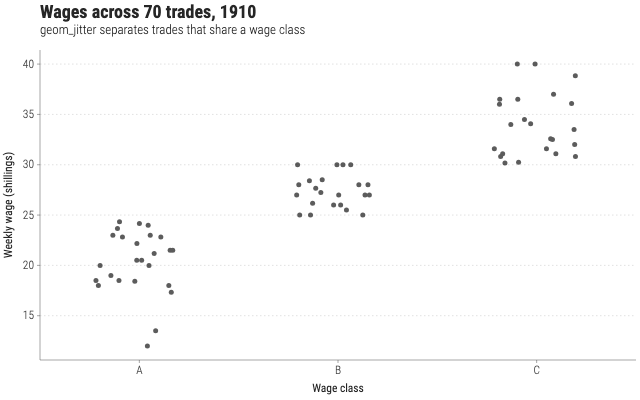
GeomJitterJittered point alias. Canonicalized by normalize() to a point layer with position jitter. Configure jitter amount via positionParams.width/height/seed. -
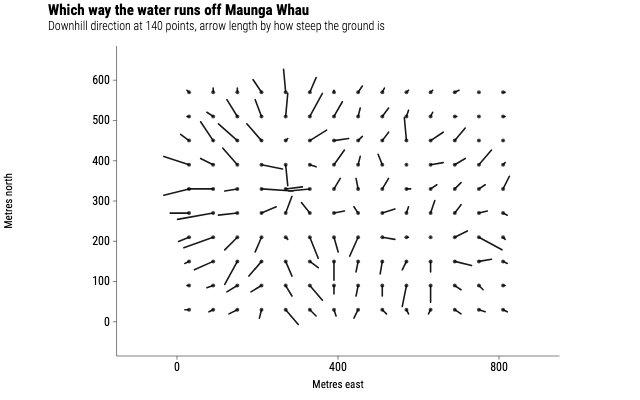
GeomSpokeSpoke geometry: one finite segment per row from (x, y) in direction angle (radians) with length radius. Endpoints are derived as xend = x + radius·cos(angle), yend = y + radius·sin(angle) in data space, then transformed like x/y. Requires continuous x and y. -
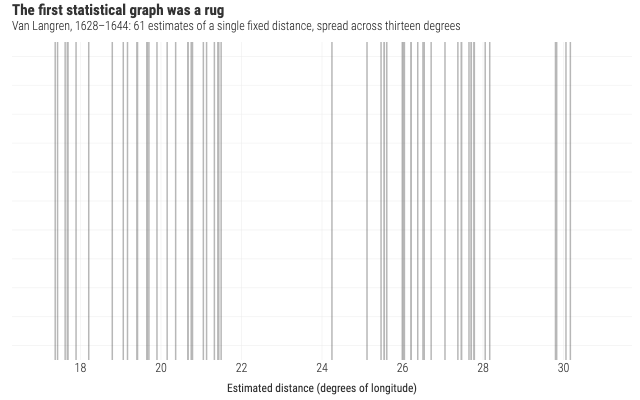
GeomRugRug geometry: short ticks along panel edges for each observation. Map aes.x for bottom/top sides and/or aes.y for left/right sides. -
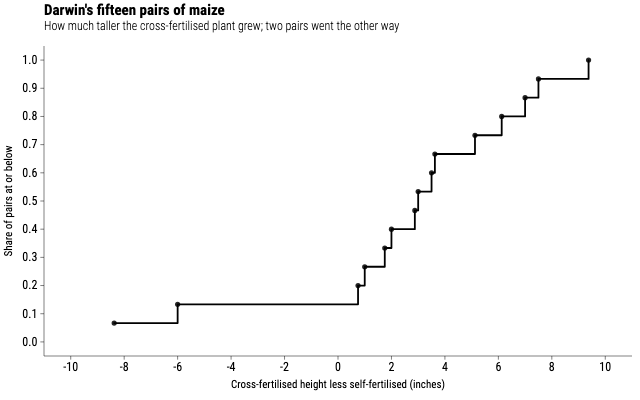
GeomStepStep-line geometry: connect points with hv/vh/mid stairs. Same channels as line; ordered by x within groups. -
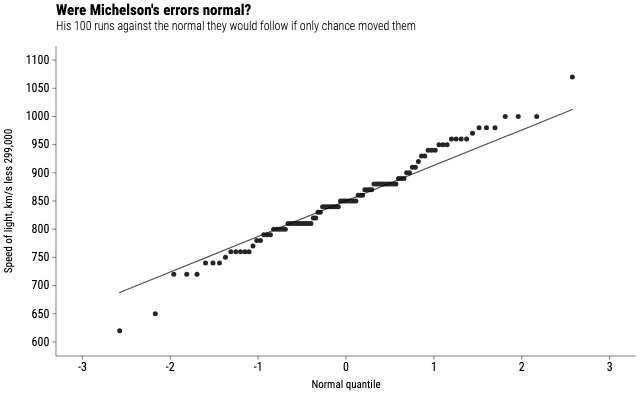
GeomQqQ–Q scatter: sample quantiles vs theoretical normal quantiles. Requires aes.sample. -
GeomQqLineQ–Q reference line: line through sample/theoretical quartile match, spanning the theoretical range of the Q–Q cloud. Requires aes.sample.
Shared layer props
Every geom shell accepts these props in addition to its own params. On the
JSON layer they are top-level fields next to geom.