Gallery / Points & scatter
point
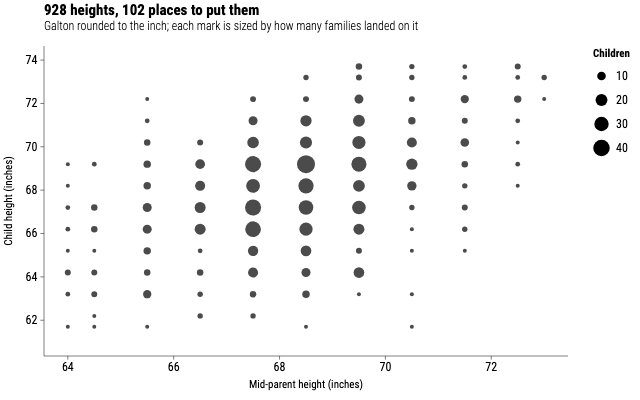
928 heights, 102 places to put them
Galton recorded parents and children to the nearest inch, so most of his table hides under a few hundred dots. Sizing each mark by its count puts it back.
Source
Svelte, builder, JSON
<script lang="ts">
  import { GeomCount, GGPlot, Labs, ThemeClassic } from "@ggsvelte/svelte";

  import { galtonHeights } from "./data.js";
</script>

<GGPlot
  data={galtonHeights}
  aes={{ x: "parent", y: "child" }}
  width={640}
  height={400}
>
  <ThemeClassic />
  <Labs
    title="928 heights, 102 places to put them"
    subtitle="Galton rounded to the inch; each mark is sized by how many families landed on it"
    x="Mid-parent height (inches)"
    y="Child height (inches)"
    size="Children"
  />
  <GeomCount alpha={0.7} />
</GGPlot>
Meta
Details
- Family
- Points & scatter
- Source
point/count- Rendering
- SVG
- Techniques
Related