Gallery / Areas
ribbon
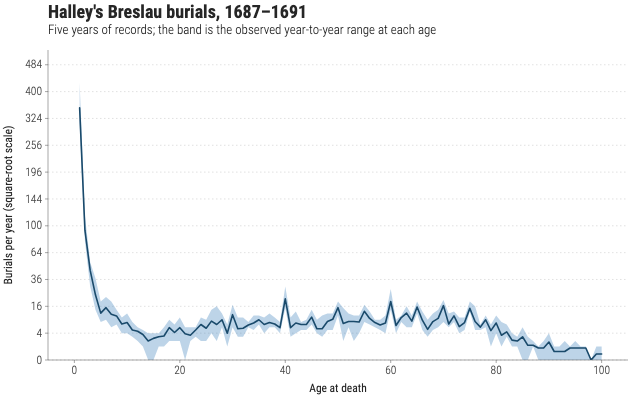
Halley's Breslau burials, 1687 to 1691
Five years of burial records by age, with the band showing the observed year-to-year range at each age around the mean.
Source
Svelte, builder, JSON
<script lang="ts">
  import {
    GeomLine,
    GeomRibbon,
    GGPlot,
    Labs,
    ScaleYSqrt,
    ThemeClean,
  } from "@ggsvelte/svelte";

  import { breslauBurials } from "./data.js";
</script>

<GGPlot
  data={breslauBurials}
  aes={{ x: "age", ymin: "lo", ymax: "hi" }}
  width={640}
  height={400}
>
  <ThemeClean />
  <ScaleYSqrt />
  <Labs
    title="Halley's Breslau burials, 1687–1691"
    subtitle="Five years of records; the band is the observed year-to-year range at each age"
    x="Age at death"
    y="Burials per year (square-root scale)"
  />
  <GeomRibbon alpha={0.35} aes={{ fill: { value: "#4385be" } }} />
  <GeomLine
    aes={{ x: "age", y: "mean", color: { value: "#1a4a6b" } }}
    linewidth={1.6}
  />
</GGPlot>
Meta
Details
- Family
- Areas
- Source
ribbon/bounds- Rendering
- SVG
- Techniques
Related