Gallery / Statistical summaries
smooth
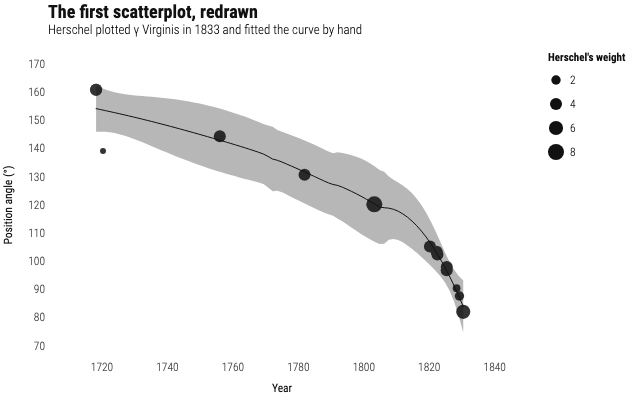
The first scatterplot, redrawn
Herschel plotted gamma Virginis in 1833 and fitted the curve through it by hand. A loess smooth with a confidence band does the same job.
Source
Svelte, builder, JSON
<script lang="ts">
  import {
    GeomPoint,
    GeomSmooth,
    GGPlot,
    Labs,
    ScaleSizeContinuous,
    ScaleXContinuous,
    ThemeTufte,
  } from "@ggsvelte/svelte";

  import { gammaVirginis } from "./data.js";
</script>

<GGPlot
  data={gammaVirginis}
  aes={{ x: "year", y: "angle" }}
  width={640}
  height={400}
>
  <ThemeTufte />
  <ScaleXContinuous labels="d" />
  <ScaleSizeContinuous range={[3, 8]} />
  <Labs
    title="The first scatterplot, redrawn"
    subtitle="Herschel plotted γ Virginis in 1833 and fitted the curve by hand"
    x="Year"
    y="Position angle (°)"
    size="Herschel's weight"
  />
  <GeomSmooth method="loess" span={0.75} />
  <GeomPoint aes={{ size: "weight" }} alpha={0.85} />
</GGPlot>
Meta
Details
- Family
- Statistical summaries
- Source
smooth/loess-scatter- Rendering
- SVG
- Techniques
Related