Gallery / Lines & time
step
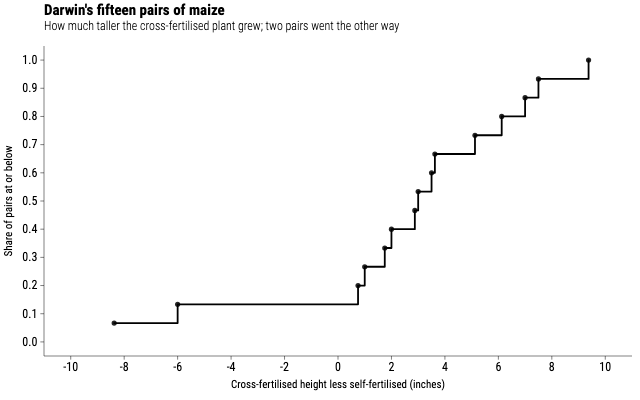
Darwin's maize, pair by pair
Fifteen paired height differences from Darwin's 1876 fertilisation trial, drawn as stairs from precomputed coordinates. Where the line crosses zero is his result.
Source
Svelte, builder, JSON
<script lang="ts">
  import {
    GeomPoint,
    GeomStep,
    GGPlot,
    Labs,
    ThemeClassic,
  } from "@ggsvelte/svelte";

  import { maizeDifferences } from "./data.js";
</script>

<GGPlot
  data={maizeDifferences}
  aes={{ x: "difference", y: "share" }}
  width={640}
  height={400}
>
  <ThemeClassic />
  <Labs
    title="Darwin's fifteen pairs of maize"
    subtitle="How much taller the cross-fertilised plant grew; two pairs went the other way"
    x="Cross-fertilised height less self-fertilised (inches)"
    y="Share of pairs at or below"
  />
  <GeomStep direction="hv" linewidth={1.8} />
  <GeomPoint size={2.6} alpha={0.85} />
</GGPlot>
Meta
Details
- Family
- Lines & time
- Source
step/ecdf- Rendering
- SVG
- Techniques
Related