Gallery / Labels & text
text
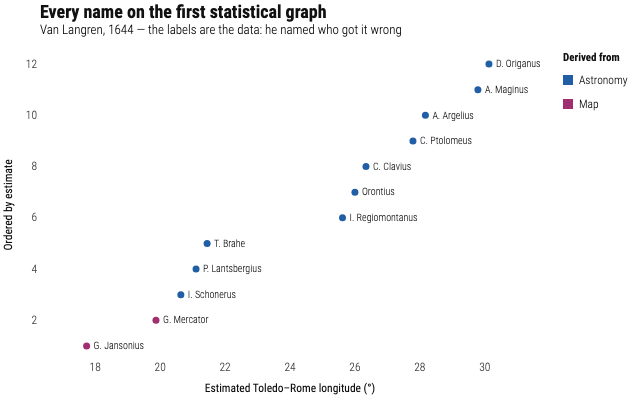
Every name on the first statistical graph
Van Langren, 1644: the labels are the data, because he named the astronomer behind every estimate including the ones that were wrong.
Source
Svelte, builder, JSON
<script lang="ts">
  import {
    GeomPoint,
    GeomText,
    GGPlot,
    Labs,
    ScaleColorManual,
    ThemeTufte,
  } from "@ggsvelte/svelte";

  import { langren1644 } from "./data.js";
</script>

<GGPlot
  data={langren1644}
  aes={{ x: "longitude", y: "rank" }}
  width={640}
  height={400}
>
  <ThemeTufte />
  <ScaleColorManual
    domain={["Astronomy", "Map"]}
    values={["#205ea6", "#a02f6f"]}
  />
  <Labs
    title="Every name on the first statistical graph"
    subtitle="Van Langren, 1644 — the labels are the data: he named who got it wrong"
    x="Estimated Toledo–Rome longitude (°)"
    y="Ordered by estimate"
    color="Derived from"
  />
  <GeomPoint size={3.5} aes={{ color: "source" }} />
  <GeomText aes={{ label: "name" }} anchor="start" dx={7} size={10} />
</GGPlot>
Meta
Details
- Family
- Labels & text
- Source
text/labels- Rendering
- SVG
- Techniques
Related